Accounting vs Economic Reality Part 3: One Size Doesn’t Fit All
This is our third entry in a multi-part series on some of the common failings of generally accepted accounting principles (GAAP).
As a brief reminder, GAAP accounting is what you will find when you open most US publicly reported financial statements. These are the numbers commonly used to assess the financial health of a given company, and these are the numbers relied upon by most of the investment industry to manage clients’ money.
However, these GAAP numbers often present an entirely misleading picture of a company’s underlying economics. In our last articles, we talked about how Stock-Based Compensation and R&D Intangibles can paint a distorted picture of a business’s economics. Today, we will talk about how accounting rules themselves, and changes to them can hugely alter the picture – even while the underlying company remains the same.
Accounting Rule Changes
Firstly, there are a large number of individual accounting rules regarding how companies must record and report their financials to the public. It is without a doubt a difficult task for the accounting boards to set these rules knowing that a single set of rules must be applied to a very diverse pool of companies. This is very much a ‘one-size-fits-all’ system. But as with most things, one size certainly does not fit all. The result is that while rules may make sense for some companies and industries, they make little sense for others.
Not only that, but the accounting standard boards seek to update, change, and amend these rules reasonably regularly. The optimistic view is that these changes are driven by a desire to make the standards more accurate and more representative, the cynical view would be that turnover of board members results in a need to be seen as ‘doing something’ and making an impact by modifying rules. The reality is probably a combination of both.
Either way, because these blanket rules can sometimes have very large and misleading impacts, you will also often find ‘adjusted’ numbers presented by management teams in their reporting. Legally, companies have to present audited GAAP numbers in their reports (unless you’re a Chinese company for some reason), however in addition to their GAAP numbers companies are also free to present additional versions of their accounts, where they may choose to make corrections to more accurately present the economic picture.
Now, management can use these adjusted numbers for both good and evil, so it is still up to the investor to do the hard work of parsing out what is and isn’t economically relevant. To illustrate this point, there are many examples of misleading accounting rules or rule changes we could discuss but, in this case, we are going to talk about one of our portfolio companies, CarMax, and why it is often so misunderstood by the wider market.
CarMax (KMX) Example
The CarMax story is often entirely confused by the market due to the muddled picture painted by the indiscriminate accounting treatment of their CarMax Auto Finance (CAF) segment. For anyone relying on GAAP financials, CarMax looks like a heavily indebted company with nil to negative cash flow. But with some work, one can discover that the economic reality is almost the complete opposite.
The problem was created by a significant accounting change made back in 2010 that arbitrarily and artificially added much higher assets and liabilities to their balance sheet. From the CarMax 10-K for the fiscal year ended February 28, 2010:
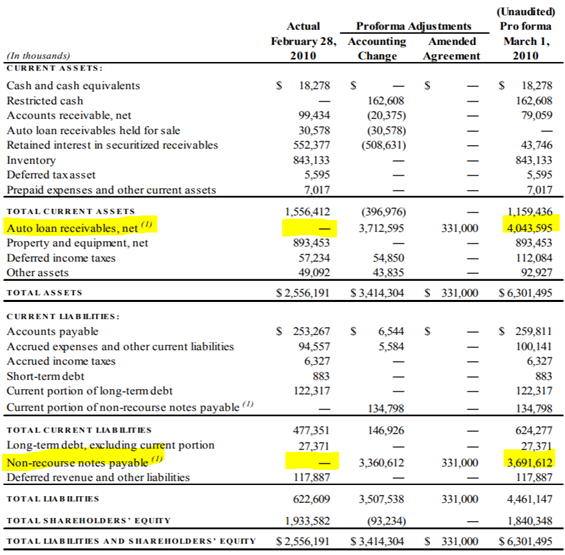
Footnote 1 above reads:
When presented in our consolidated financial statements beginning in the first quarter of fiscal 2011, the assets and liabilities of the securitization trusts will be separately presented on the face of the consolidated balance sheet, as required by ASU 2009-17, to reflect the fact that trust assets can be used only to settle trust obligations and that the trusts’ creditors (or beneficial interest holders) do not have recourse to the general credit of CarMax.
In other words, CarMax was made to consolidate CAF liabilities (securitized car loans) on their balance sheet that aren’t really true liabilities, because these are ‘non-recourse’, meaning that CarMax shareholders are not on the hook if those loans go bad.
Oversimplifying this a bit, the way this works is that CarMax makes loans to customers buying cars and then they finance those loans by bundling a bunch of them together and selling them to investors as securitized notes. Thus, CarMax is a kind of middleman that makes the spread on the interest rate that customers pay them versus what they pay investors. If a customer doesn’t pay, it is the investors that stand to lose principle, not CarMax.
But the accounting rules state that CarMax needs to report this ‘phantom’ debt and include a receivables balance to offset it. Everything balances, but unfortunately the way modern data reporting systems work, this still creates a lot of problems elsewhere.
For example, a very common metric that our industry uses to judge the financial health of a company is Net Debt to EBITDA, or in other words, how many years would it take to pay off a company’s debt if all cash flow was directed to that purpose. The lower this ratio, the better.
To illustrate the problem, below is CarMax’s balance sheet as of fiscal year-end February 28, 2021:
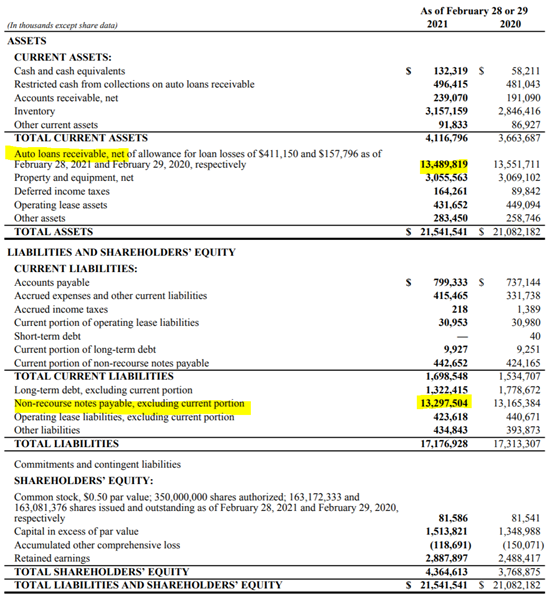
In FY2021, according to FactSet, KMX had EBITDA of $522M and net debt (as shown above) of north of $15B giving them a Net Debt to EBITDA ratio of nearly 30x. A company carrying leverage of 30x is a hugely risky prospect by any measure. But this number has no actual basis in reality as to CarMax’s true risk level.
Consider firstly, that a genuine investor would adjust this number for those non-recourse notes that aren’t true economic liabilities, thus decreasing the Net Debt number in the equation. Secondly, doing a little more work we would see that FactSet does not include CAF income in their EBITDA number (likely because the system assumes it is below the line interest income when it is actually operating income).
Adjusting for both and the Net Debt to EBITDA ratio falls to less than 1x – entirely reasonable.
So, where the rest of the market might see 30x, with just a little bit of work we see the true economic picture of less than 1x. A massive difference. All those managers using accounting ratios, using stock screeners, or running ‘factor’ portfolios would entirely miss the CarMax opportunity. And many have for many years.
It gets worse, the cash flow picture painted by this GAAP rule change is just as distorted. Not only does CarMax look like its highly levered on a GAAP basis, but it also looks like they are burning cash – a recipe for bankruptcy.
The CarMax management team made an effort to address this issue back in their FY2010 10-K where they talked about the accounting change and its impact on cash flows:
In future periods, because our securitization transactions will be accounted for as secured borrowings rather than asset sales, the cash flows from these transactions will be presented as cash flows from financing activities rather than as cash flows from operating or investing activities.
In simpler terms, cash flows for what is very much an operating activity for CarMax, would now need to be recorded as a financing activity. This creates issues for financial reporting software because the way financial ratio reporting usually defines free cash flow is:
FCF = Operating Cash Flow Less Capital Expenditures
Simply – how much cash is the company generating, less the amount it needs to invest in the business.
Let’s look at CarMax’s consolidated statement of cash flows from the most recent FY2021, and let’s focus on FY2020 this time since there are other Covid-19 impacts to 2021 that muddy things further:
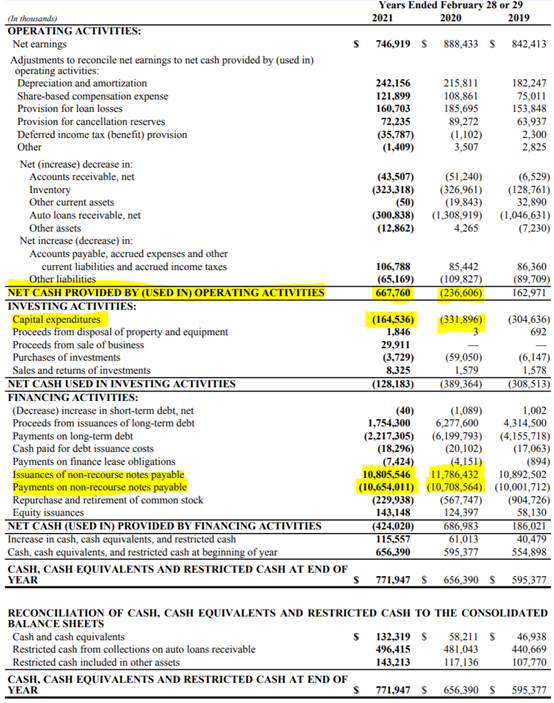
So, using the above formula, FCF for CarMax in FY2020 would be -$569M. Ouch. But as we just read, the economic reality regarding this cash flow is more complicated. From the FY2020 10-K:
When considering cash from operating activities, management uses an adjusted measure of net cash from operating activities that offsets the changes in auto loans receivable with the corresponding changes in non-recourse notes payable. This is achieved by adding back the cash provided from the net issuances of nonrecourse notes payable, which represents the increase in auto loans receivable that were funded through the issuance of non-recourse notes payable during the year. The resulting financial measure, adjusted net cash from operating activities, is a non-GAAP financial measure. We believe adjusted net cash from operating activities is a meaningful metric for investors because it provides better visibility into the cash generated from operations.
So, as we’d said above, CarMax management has decided to present their own ‘adjusted’ number to account for this accounting rule misstep. Once those corrections have been made, we end up with FCF of positive $509M. Again, where the investment industry sees a negative $569M, the genuine investor sees a positive $509M. Relying on straight accounting numbers and ratios would mean you’re off the mark by over a billion dollars, in just one year.
Conclusion: The True Economics of CarMax
CarMax is unique in the space due to its combination of a used car retail operation with both a first-party wholesale business as well as a first-party financing business. This allows CarMax to play across the whole used car value chain which leads to very attractive economics – the wholesale and financing businesses are ultimately linked to core retail unit sales but require very little incremental capital on top to generate significant profits, leading to CarMax’s best-in-class ROE numbers despite using more modest leverage than peers.
And none of this amazing story could be gleaned simply by looking at consolidated GAAP numbers.
Such issues are prevalent in many companies and many industries. The key takeaway is that all investors should understand the true economic reality of any business they are considering investing in. Solely using reported accounting numbers to make investment decisions is like using a map without checking which way is North.
Disclosures: This website is for informational purposes only and does not constitute an offer to provide advisory or other services by GCI Investors in any jurisdiction in which such offer would be unlawful under the securities laws of such jurisdiction. The information contained on this website should not be construed as financial or investment advice on any subject matter and statements contained herein are the opinions of GCI Investors and are not to be construed as guarantees, warranties or predictions of future events, portfolio allocations, portfolio results, investment returns, or other outcomes. Viewers of this website should not assume that all recommendations will be profitable, or that future investment and/or portfolio performance will be profitable or favorable. GCI Investors expressly disclaims all liability in respect to actions taken based on any or all of the information on this website.
There are links to third-party websites on the internet contained in this website. We provide these links because we believe these websites contain information that might be useful, interesting and or helpful to your professional activities. GCI Investors has no affiliation or agreement with any linked website. The fact that we provide links to these websites does not mean that we endorse the owner or operator of the respective website or any products or services offered through these sites. We cannot and do not review or endorse or approve the information in these websites, nor does GCI Investors warrant that a linked site will be free of computer viruses or other harmful code that can impact your computer or other web-access device. The linked sites are not under the control of GCI Investors, and we are not responsible for the contents of any linked site or any link contained in a linked site. By using this web site to search for or link to another site, you agree and understand that such use is at your own risk.