
Fourth Quarter and Full Year 2022 Update
Dear Partners,
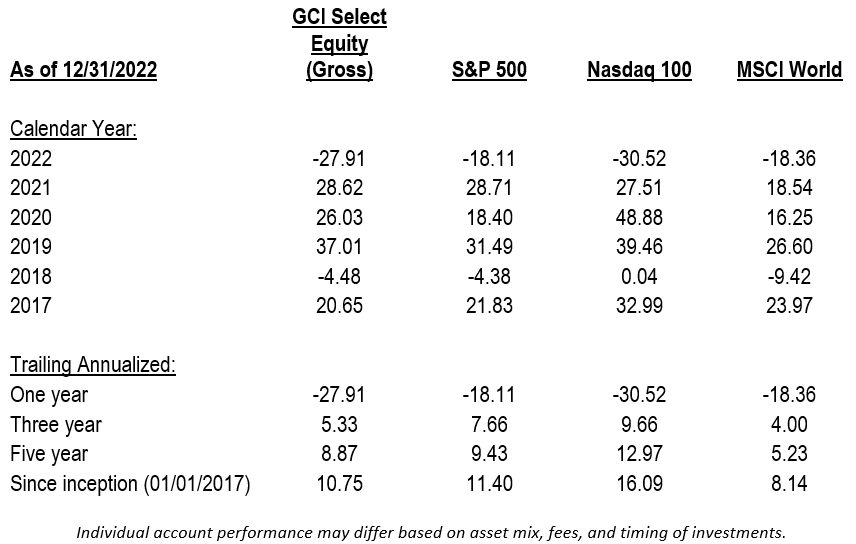
This past year has been one of the worst for asset markets in over a decade and our core GCI Select Equity strategy was no exception – posting disappointing results.
As you know, GCI was founded on the principle that investing in high-quality companies at attractive prices is the most durable and consistent way to achieve long-run, risk-adjusted returns. As such, we avoid short term market timing efforts and instead seek to partner with truly exceptional businesses where we can be confident that our shareholder value will continue to compound over time, no matter what may happen with short-term stock price movements.
While we aim to outperform the market over the long run, we do not expect to outperform every single year, and while 2022 was a significant drawdown in isolation, it is also not entirely unsurprising after many years of very strong returns.
This past year was highly unusual in that it saw a significant decline in both stock and bond markets, two asset classes that have historically been negatively correlated. In fact, US Treasuries posted their worst year in over a century. This had significant implications for multi-asset portfolios where stocks and bonds are held together in order to benefit from that negative correlation – when one asset class is rising the other falls, and vice versa. That normal diversification benefit proved to be of little help in 2022.
Now, it is important to take some time to understand why markets were so weak during 2022 and what it might mean for the future.
At a high level, there were several obvious issues this year, such as a full-scale invasion on Europe’s doorstep and inflation levels not seen since the 1980’s. However, we would argue that the most significant impact on asset prices (both stocks and bonds) during 2022 was the decision by the Federal Reserve (and most global central banks) to increase interest rates at the fastest and steepest pace in history – with the Federal funds rate going from near zero at the beginning of the year to 4.25%-4.5% by the end.
Why are higher interest rates so negative for asset prices?
To answer this question, it helps to think of interest rates in terms of first principles – in that interest rates are effectively the price of money. Banks, investors, and businesses tend to borrow money so they can put it to work in generating a profit. The cost of borrowing that money is the interest rate.
Most businesses and individuals borrow money from banks. Banks lend out money from their limited deposits and money they themselves borrow from other banks (often overnight, or for short periods).
The Federal Reserve is able to influence this bank to bank lending cost through the Federal funds rate – the rate at which those interbank transactions take place. So, if the Fed raises the Fed funds rate then it costs banks more to borrow money, which means they must charge businesses and individuals more when they lend it out again, such that the bank can still generate a profit.
Higher interest rates have several implications:
- The economy slows – Raising interest rates is referred to as ‘monetary tightening’ because it results in less borrowing happening overall which can lead to the whole economy slowing down. If it costs more to borrow money now, people will likely borrow less of it. For example, if you’re a company about to invest in a project that might return you 8% and your bank is only charging you 4%, you may well go ahead and take your 4% net return. If your bank is now charging you 7% to borrow money, your 1% return isn’t so attractive, so you’re likely to not bother. Less money is borrowed, less is spent, less moves around the economy, and the economy thus slows down. If one’s goal is to decrease demand and slow inflation, this slowing down is a good thing.
- Bond prices fall – Bonds offer a set return, whether they are treasuries or corporate bonds. Let’s take an example bond issued with a value of $100 that pays $5 a year in coupon or a yield of 5% to investors. That may be attractive when investors are only receiving 0.5% on their cash balances at their bank. However if interest rates rise, the interest they can earn on straight cash (zero risk) rises as well. So perhaps they’re now getting 3% on their cash. All of a sudden, the bond that is giving them 5% doesn’t look so attractive, given they’re still having to take credit risk of the issuer. So investors sell the bond, pushing the price down. The $5 coupon still exists, but maybe now the price of the bond has dropped to $80 from $100, so the $5 coupon is now a yield of 6.25% when it started as a yield of 5%. The price of the bond will fall to a level where the yield is high enough for investors to feel that they’re being fairly compensated for taking credit risk. Therefore, bond prices fall when interest rates rise. The offsetting positive is that any new money invested in bonds generates higher yields than it did previously.
- Stock valuations fall – This is where things get interesting. Higher interest rates typically lead to lower stock prices. Stock prices at any point in time, should theoretically represent the value of the future cashflows that a business will generate for its owners (the shareholders). So, a stock today is worth what it will generate for us in cash in the future. However, cash in the future is worth less than cash today – for the simple reason that if we get $100 in five years’ time, that’s just $100. If instead we get $100 today, we can invest it for the next five years and in five years’ time it’ll likely have grown to maybe $150. The higher value of a dollar today versus a dollar in the future is accounted for in company valuation through something called a discount rate. A discount rate is a percentage at which future cash flows are ‘discounted’ back to today. In simple terms, think of it as the annual rate you could expect to earn on your dollars if you put them elsewhere – effectively your opportunity cost of investing. The further in the future your cash flows, the more years you have to discount them back to today, and the less those cash flows are worth in real terms. And the higher the discount rate you use, the less those future cash flows are worth today also. If interest rates are rising, the return you can achieve today from cash deposits or other investments is also rising, so the rate at which you need to discount future cash flows also needs to rise. With higher interest rates you have a higher ‘opportunity cost’ of capital, so your discount rate needs to be higher. With a higher discount rate, future cash flows are worth less to us today than they were before, so the value of the company falls based on this measure.
- Some sectors are harder hit than others – You likely have seen commentary about how badly tech stocks have done this year compared to most other sectors. Well, a big part of the reason for this is that a lot of tech companies don’t make much money today but are growing really fast and are likely to make a lot of money in the future. But if our opportunity cost of money is rising (discount rate is rising) then any company with most of its cashflow lying many years out will see a bigger valuation reduction than a company that’s producing most of its cash today. Hence tech company stocks falling harder.
You will probably all be thinking this sounds very theoretical, and some of it is. There are some key takeaways and important points to note though.
For starters, we never expected interest rates to stay at zero forever. As such, we were never using the discount rate that the market would imply when underwriting our investments, so the sudden change is interest rates hasn’t hugely affected our internal valuation assumptions.
Secondly, the most important element in investing remains the same – a focus on the real earnings that each of our companies can generate in the future. Regardless of discount rate changes, interest rate changes, etc., if we are invested in high quality businesses that are going to compound their earnings well into the future, then we will achieve good long-term investment returns as well. Stock prices may take short-term hits when the Federal Reserve raises interest rates, but if we do our work right, these hits will be overshadowed by fundamental progress at our businesses.
The truth is – if interest rates moving a few percent is enough to invalidate your investment thesis, then it wasn’t that great of an investment thesis to begin with. Remember that stocks have weathered double digit interest rates before, as well as world wars, pandemics, the threat of nuclear war and so on. And still over the long run, stocks as an asset class continue to provide healthy returns, and we are confident that they will continue to do so going forward for anyone that can take a view that is longer than year.
To provide more detail on how and why we can have such confidence, what follows is a summary of every business we have chosen to invest in and why. Keen observers may notice the list of companies is slightly shorter than last year as we have used significant valuation opportunities this year to concentrate capital in our highest conviction investment ideas, while maintaining sufficient overall diversification.
If you would like to discuss any of these in more detail, or arrange a personal portfolio review, please reach out and we would be happy to arrange. As always, we thank you for your continued partnership.
Kind regards,
Guy Davis, CFA
David Shahrestani, CFA
GFL Environmental (GFL)
GFL operates as the fourth largest public player in the waste management industry. This industry is characterized by high barriers to entry (land use regulations on landfills as well as scale economics on route density), stable non-cyclical demand, and exceptional pricing power that has historically exceeded inflation. The resiliency of this industry is hard to overstate – even during the recent Covid-19 induced global lockdowns, overall volumes barely dropped.
Patrick Dovigi (CEO) started GFL in Canada back in 2007 when he was just 27 years old, growing the business from nothing to $5B+ in revenue over the subsequent 15 years. This was accomplished through an aggressive M&A strategy in the private markets where Mr. Dovigi took the stable economics of the Canadian waste market (disposal neutral, heavy mix on collection, recurring revenue) and leveraged it up 7-10x to further acquire smaller independent players.
Having now scaled up and progressed into the US, the runway to continue executing on this strategy is significant. At age 43, Mr. Dovigi retains a lot of skin in the game as GFL’s largest shareholder and is heavily incentivized to continue growing the business in a prudent manner.
We would argue that there have been two short-term headwinds for performance in 2022. Firstly, GFL is a relatively new IPO (2020) with a significant overhang of Private Equity ownership that will continue to be net sellers of GFL’s stock over the medium term. While this creates selling pressure, it also allows us to continue building our stake at very attractive prices.
Secondly, GFL runs at a higher leverage rate than peers (4-5x versus peers at 2x). As such, the fear of rising interest rates has disproportionately punished GFL. How much of a worry should this be? Well, as we already talked about, GFL’s end markets are remarkedly stable, even IPOing into the worst crisis for their end markets in a generation and they came out of it relatively unscathed. Furthermore, as GFL digests some very large platform deals and their credit quality organically improves, they should be able to refinance their debt at spreads closer to peers, partially offsetting the higher rate environment.
Management also has the option to divest some subscale assets picked up in their recent platform deals. In their most recent quarterly conference call, Mr. Dovigi noted that there was strong interest for these assets, which they could likely sell at multiples well ahead of where GFL trades in the public markets. Doing so would allow them to quickly retire their highest rate debt and bring their leverage ratio in line with peers.
Either way, we believe much of the debt-overhang part of the bear story here should be removed in the coming year. This will be a significant catalyst for performance considering how much of a discount GFL trades at relative to its peers.
Going forward there are multiple ways for us to win here: 1) The core solid waste business should naturally de-lever and their best-in-class management and growth profile should at least allow them to re-rate to the peer group. Even without a re-rating, we are still looking at a base business that can compound FCF at 15% for much of the next decade. 2) There is an upside option in their recent renewable natural gas (RNG) investments. Their internal goal is for these investment to produce $150-$200M per year in EBITDA, and assuming a three-year ramp the IRR on these investments could be 40%+ and eventually spun-off to shareholders. 3) There is also an upside option in their Green Infrastructure Partners (GIP) business which they recently divested while retaining a 45% interest. This will likely be a GFL 2.0 type roll-up in the highly fragmented Canadian infrastructure services market. Management will likely IPO this business in the coming years, unlocking significant value for GFL shareholders.
Air Products & Chemicals (APD)
APD builds, owns, and operates large scale gasification plants that produce gasses (oxygen, nitrogen, hydrogen, etc.) for use in a variety of different end markets. Substantial amounts of gas are required in a wide (and increasing) variety of industrial processes: steel production, oil refining, food processing, medical applications, as well as huge nascent future trends such as hydrogen mobility.
For many large-scale industrial applications, APD will build a multi-billion-dollar gasification plant on site at a customer’s production site. These mega-scale projects make up an increasing portion of APD’s business which is no accident, but rather a key strategy by management going forward. Which begs the question, what is so great about these mega-scale projects?
Firstly, smaller scale ‘bulk’ gas and liquid business is a lot more competitive in foreign markets. In China alone there are tons of local players, who are competitive on pricing, and often favored from a nationalistic point of view. But there are rarely any local players that can handle the end-to-end solution, as well as the capex required, to compete with APD at the mega-project scale.
Consider that these projects are extremely capital-intensive. We are talking about $1B at the low end up to $9B in the case of the Jazan gasification and power production project in Saudi Arabia. We can kind of think of APD as a bank providing a loan in some of these foreign countries (APD invests alongside a customer in these projects, customer repays over time), hence why APD has made it a priority to have a very strong balance sheet relative to their peers. Additionally, these projects are not only expensive, but few and far between, making it hard for an upstart to build a track record of execution.
In other words, APD is unique in the marketplace as being able to both finance and execute on these projects.
Secondly, putting up the initial capital for these mega-projects gets rewarded with long-term, fixed income like, take-or-pay contracts. Think 15-20-year deals where there’s sort of a recession proof take-or-pay clause built in as long as the customer remains a going concern. The contracts have baked in inflation escalators, and APD takes no input price risk.
This is a very good place to be, and APD is over-indexed to this on-site, take-or-pay model relative to peers that do more liquid bulk or packaged gas products in the commercial market. Consider that back in 2015, maybe 40-50% of APD’s business was these type of take-or-pay long-term agreements, today that is closer to 70% and management wants to get it to 80%+.
Thirdly, these economics are all magnified at the end of the contract period. When it comes time to reprice these contracts at the end of say 15 years and rolling the contract for another 15 years, APD will reinvest in the plant, but they will not be rebuilding the plant from scratch, yet they still get to price on a replacement basis.
Any upside from not having to physically recreate the plant would flow straight to the bottom line. That is how these on-site deals become so profitable over time, it’s when the contract is rolled – you might do 20% of the original capex in upgrades and maintenance, but you price it on a 100% basis. In other words, your incremental ROIC goes straight through the roof.
Going forward, core organic growth should track at roughly 1.5-2x GDP, and management is in the process of deploying roughly $18B in capital in these large on-site projects in emerging economies, which they expect at least a 10% IRR on. On top of that there is room to continue aggressively reducing fixed costs – operating margins have gone from 16% to 25% during CEO Ghasemi’s tenure and we could see them getting to 28% over the next decade through a combination of mix shift to higher margin mega projects, contract re-roll pricing, and SG&A leverage over less projects.
Microsoft (MSFT)
Microsoft is probably best known for its Windows operating system, though today Windows is a small portion of Microsoft’s business, now massively overshadowed by their Cloud (Azure) and Productivity Software suite of services (Office).
In the cloud, Azure is well-positioned to gain share in a fast-growing, massive market opportunity where they are a more natural partner for enterprise customers compared to the current market leader, Amazon’s AWS. While scale is key in this market, Azure stands in the unique position of being the only cloud company who participates at every single layer of the cloud ‘stack’ from software all the way down to physical hardware, and every stage in between. Outside of the cloud, Office remains one of the best businesses of all time on a stand-alone basis and looks even better when we realize Microsoft can leverage their massive installed base as a touchpoint for customer acquisition in Azure.
But why are we so bullish on the cloud markets potential? Aside from recent developments in the cutting-edge Artificial Segment space (it is estimated that the recently launched ChatGPT spends $3M a day, or $1.1B a year, on Azure compute), it appears to be a secular trend that every segment of our economy is getting more data and compute dependent.
Azure is one of those rare companies, like Mastercard or S&P Global, where their terminal growth rates naturally track nominal GDP growth. In other words, as the economy grows these cloud infrastructure companies grow with it, even adjusted for inflation. But growth alone doesn’t mean much if there isn’t a moat to protect long-term margins. The bear case here continues to be that this industry will end up like other low switching cost, high fixed cost businesses like the Airlines, where pricing wars eventually eat into margins.
But the evidence hasn’t been the case so far. Consider that margins, (where reported) have actually been increasing even as pricing has continued to come down. This suggests that there are real switching costs, whether that be because of the infrastructure pipelines that need to be built, because of the training expense to get a workforce up to speed with a single cloud architecture, or most likely, because of the additional suite of platform and software solutions that customers use in addition to the cloud services that make each public cloud into an interconnected web that is hard to dislodge once onboarded.
All of this is then further reinforced by a virtuous cycle of technological learning curves and scale economies on cost. This is one of the most attractive opportunities in the market today.
Putting everything together for Microsoft, and we are looking at a $1T+ mission-critical company that is growing faster than many smaller companies and doing so with tremendous operating leverage. While Microsoft may look expensive relative to its past, their market opportunity and growth rates far outpace historical comps, and the company should be able to deliver at least mid-to-high teens EPS growth going forward with upside from deploying their significant cash balance like we saw this year with their Activision purchase.
United Parcel Service (UPS)
UPS is the largest package delivery company in the world, delivering an average of 20 million packages per day across 220 countries. In terms of global density-based networks, it is hard to imagine one more impressive than UPS.
Although holding up better than the market, UPS sold off in 2022 due to 1) cyclical concerns and 2) a fundamental misunderstanding of the competitive risk UPS faces.
On the cyclical side, UPS has historically been a bellwether for the economy, a gauge of worldwide business activity. It follows that if the market is worried about an upcoming recession, then UPS might be one of the stocks that get sold off first. The problem with this narrative is that it completely ignores how UPS has evolved over the past few decades- from a business that was predominantly about business-to-business parcel delivery to one that has ridden the secular wave of e-commerce and business-to-consumer parcel delivery.
More importantly, the market has underestimated what CEO Carol Tome, of Home Depot fame, has accomplished with her ‘Better not Bigger’ approach to managing the business. Margins are at record levels while there is supposedly an e-commerce Covid-19 induced hangover weighing on volumes. We believe the market is missing the forest for the trees here by underestimating the strong foundation Mrs. Tome is building for the next decade of what is likely to be secularly growing parcel shipments in the country.
On the competitive risk side, we need to look ‘under the hood’ of the main players in this market – UPS, FedEx, and more recently, Amazon.
Both FedEx and Amazon have grown their delivery businesses very quickly, but they crucially have done so at much lower returns – i.e., they are much less efficient (this is partly estimation regarding Amazon, but the reasoning will become clear in a moment). Why does UPS consistently earn 20%+ returns on capital, whilst FedEx can’t even get to 10%?
We believe the answer is that UPS runs a fully integrated model, they own everything: ground, air, express, trucks, planes, etc. On the other hand, both FedEx and Amazon are franchised models, meaning they have agreements with franchisees, and as such are restricted in how they can optimize their own routes, labor, and services.
UPS has total freedom to optimize and structure their operations in whatever way is most efficient- a structural advantage that can’t be replicated after the fact. The benefits of this advantage have been seen most prominently this year with the divergence in FedEx and UPS financial results in the face of growing inflation and slowing volumes. Where FedEx has continued to be a basket case, UPS has delivered solid results that we would expect from such a well-run business.
The market was recently reminded of the fundamental bottleneck in capacity of the global logistics network during the Covid-19 crisis. It was during this period that the value of UPS was on clear display. Today, we are working through some of the excesses that Covid-19 created, but on a longer time frame, we believe it is clear that the value of UPS network is only increasing.
Copart (CPRT)
Copart operates as part of a duopoly in the auto salvage auction market, along with their smaller peer, Insurance Auto Auctions (IAA).
In simple terms, the way the auto salvage market works is that if you total your car in an accident, your insurance company sends your car to one of Copart’s lots to be sold in a global online auction to dismantlers, dealers, etc. (matching local supply with global demand). Copart (usually) doesn’t take ownership of the car, they are just the middleman facilitating the logistics of the transaction, for which they take a commission.
Copart is a very high-quality business for several reasons. Firstly, the auto salvage business model is reliant on lots of land on which to store salvaged vehicles. That land needs to be close to wherever the vehicle crashed (reducing transport costs). Junkyard land is incredibly hard to come by, particularly in and around urban areas as zoning is very difficult to achieve- since most people don’t want a 100-acre junkyard built anywhere near them.
Copart is the largest national owner of this rare industrial use land, with more than 250 yards and more than 10,500 acres – noting that they sometimes must wait 20 years for new land to open in a geography. This is a significant entry barrier and similar the one that exists in landfills (GFL) or the cell towers (CCI, AMT). This relatively fixed cost asset base is not only a competitive advantage, but also allows Copart considerable earnings and cash flow leverage when they are able to put additional capacity through these assets. That excess cash flow then provides considerable reinvestment power, which supports even more land growth. This moat is incredibly strong and getting stronger over time.
Secondly, Copart’s model is classic two-sided online marketplace (like Facebook or Booking Holdings) a business model that is very hard to create, but once established often leads to some of the best economics in the world with incredible barriers to entry. One of the beautiful things about these networks is that customer acquisition costs decline as these networks grow, leading to incredible incremental economics. With Copart, insurers want to send their salvaged cars to where the most bidders are to ensure a good sales price, and bidders want to come to where the largest selection of salvaged cars are.
Thirdly, Copart benefits from a non-cyclical and stable end market – simply because people continue to crash cars in good times and bad times. The overall crash rates per year are in fact mostly dependent on the physical stock of cars on the road and miles driven, both of which tend to increase fairly steadily each year.
Finally, Copart is a wonderful example of strong corporate culture, management discipline and alignment with shareholders. The original founder Willis Johnson now serves as Chairman, with his son in law Jay Adair as CEO. Before anyone screams ‘nepotism’ – Jay worked at Copart long before becoming Johnson’s son in law. As CEO, Jay is arguably underpaid compared to his counterparts in salary terms, because he instead chooses to receive his compensation predominantly in stock.
Indeed, there is significant stock ownership throughout the board – an excellent example of shareholder alignment. In addition, this management team have repeatedly displayed their caliber and ability throughout their tenure, such as standing publicly apart from their competition in supporting customers by refusing to take advantage of natural disasters by putting through aggressive price hikes. The management team have also consistently been great capital allocators, particularly in regard to stock buybacks where they have been both highly selective, and at times aggressive.
Copart isn’t a company where management blindly buys back stock consistently, regardless of price or potential returns (unlike other less rational management teams), instead management will only conduct buybacks when the returns on those buybacks exceed their other investment opportunities – exactly as buybacks should be.
Going forward, the incremental value creation for us as investors here will depend on a few key variables:
- Total loss rates – this is simply the number of cars that get salvaged versus those that are sent to a repair shop. Total loss rates have been trending up from around 4% in the 1980s to about 20% today. There are some secular trends driving this steady increase. For one, Americans are holding onto their vehicles longer with the average age of vehicles on the road at record highs – with older vehicles more likely to be salvaged than repaired when they get into an accident. Another trend is that cars are getting more expensive to repair as their complexity increases. Cars today have sensors, cameras, and various expensive electronics all over them, meaning even minor damages can now be simply too costly to repair.
- Average Selling Price – The largest source of revenue for Copart is the commission they take on the sales price of vehicles in its auctions. In the past, a salvaged car might have just been worth the cost of the metal it could be broken down into. Today, with more and more cars being deemed salvage due to the excessive costs of repairing, much higher value cars with just dents and minor cosmetic issues are flowing through Copart’s auctions. Furthermore, as Copart has expanded their auctions internationally they have increased the liquidity of their auctions, leading to higher bids and thus higher revenues.
The biggest news here in 2022 was that their less impressive competitor, IAA, continued their long history of new ownership, this time being acquired by Ritchie Bros. at a multiple significantly higher than Copart.
We believe there remains a long runway here for reinvestment into salvage land at ~30% returns on capital. Copart should be able to drive ~5% volume growth due to total loss rates increasing and another ~5% on the pricing front. And add to that the significant opportunity to continue their international expansion (UK, Ireland, Germany, Dubai, etc.), as well as operating margin leverage from a reasonably fixed cost base, and we can comfortably see mid-double-digit earnings growth over the medium term, with our downside likely supported by aggressive buybacks at more accretive prices.
First American Financial (FAF)
FAF is one of the two dominant players (along with Fidelity National Financial) in the title insurance industry. They are the sort of very profitable, dependable, defensible company providing a keystone service which tends to be overlooked by many investors seeking something a bit more exciting.
Under American law, the title of a house is not recorded in a centralized government database. Instead, title records are held in a wide variety of local databases often consisting of unstandardized records with things like property boundary lines found in hand-drawn maps. This makes these types of records particularly difficult to standardize to speed up the title underwriting process.
This is where the title insurers come into play. Over their hundred-plus years of existence, they have been able to build up multiple centuries worth of data in each of their specific geographies in databases called “Title Plants”. The complexity of these title plants, as well as the need to forge relationships with key market participants (real estate agents, bankers, lawyers, etc.) has led to the consolidation of the industry into a small group of large players, with very little price competition.
Since title insurance is a policy to protect against the past, a title insurer’s ability to avoid losses is dependent on how well they conduct due diligence. For example, only about 4% of FAF’s premiums go to paying out claims (and these are usually fraud related). 85% or so of the premium (less over time with efficiency gains) goes toward operating expenses. For comparison, a normal property and casualty insurance company has an 80% loss ratio and 20% expense ratio. As such, we believe the market is mischaracterizing FAF’s economics when they lump them in together with other insurers.
FAF’s stock price has been unfairly punished in sympathy with the rest of the housing market in 2022. Recall that the Fed has been raising interest rates this year to combat inflation, a policy which has the added effect of making debt financed purchases less attractive. It is then no surprise that this has the further effect of slowing housing purchases, which are the largest debt financed purchase most consumers make.
The problem for us as a country is that since the Great Financial Crisis housing activity has already been depressed. While it may have looked like home prices only went up during that period, the volume of transactions and more importantly the number of new houses being built continued to run significantly below pre-GFC levels despite continued population growth.
Then came Covid-19 and zero interest rates. All of a sudden, demand for relocation along with stimulus dollars acting as down payments, meant that housing activity boomed. This muddled what should have been a steady rebuilding of housing activity as millennials reached home creation age and their savings finally allowed them to become homeowners. As with most booms, then came the crash in activity on the other side, this time not due to market excesses like with the GFC, but due to interest rates rising faster than at any time in history, thus freezing the market as any potential buyers decided it is best to wait and see how things pan out with interest rates.
But it is important to understand that this temporary activity freeze in housing does not change the fact that there continue to be far more people who want to buy a home than there are homes on market. For FAF in particular, it is important to understand that while refinance transaction will fall significantly in this environment, FAF earns better economics on new home purchase and commercial real estate transactions which will continue to offset that decline, as we have seen this year.
At today’s valuation, nearly its lowest in over a decade, what we get here is a very well defended business with strong underlying returns and even if the macro picture does not improve, we can likely still expect low double-digit returns going forward. If the cycle does improve and efficiencies continue to be extracted from the business, there is room for significant upside.
Amazon.com (AMZN)
Amazon benefits from, as well as dominates, two of the longest runway secular growth stories in the market today – the shift to cloud-based IT infrastructure (which we already talked about with Microsoft) and the shift to online-based e-commerce.
On the retail side, it helps to understand that Amazon is not really in the retail business, they are in the infrastructure business. Said another way, Amazon could make no money from direct retail sales (not far from the reality today) and still come out ahead through a combination of their Prime Membership model and the tax they can levy on suppliers through Fulfilled by Amazon (FBA) as well as the cost of advertising on Amazon’s platform.
Amazon defends their position here through a self-reinforcing loop – Prime customers are attracted by goodies like free shipping and video streaming, which attracts FBA suppliers who want access to Prime’s established high spend customer base (most of which don’t even look at price or shop around, very sticky), which allows Amazon to negotiate for better deals for their Prime customers, which in turn attracts even more Prime customers, in a virtuous cycle.
The story for Amazon retail in 2022 was one of short- term overbuild. Coming out of the Covid-19 crisis, Amazon’s management mis-forecasted demand – like many in the market, they thought the increased e-commerce activity that lockdowns created would be sticky, rather the phenomenon reversing once lockdowns were lifted. That is just to stay the step up in e-commerce demand stepped back down, not that the trajectory of ever-increasing e-commerce penetration reversed.
But for a company like Amazon providing the infrastructure backbone for e-commerce, a bad forecast on demand translates into many billions of dollars on infrastructure spend. Consider that from 2020 to 2022 Amazon invested nearly $150B in Capex plus another $30B on leases, well ahead of revenue growth.
What this means today is that Amazon has short term overcapacity (which is what the market is focused on) but it also means that going forward, revenue can grow faster than Capex at Amazon for a long time, and while the infrastructure that has been built may depress near term margins, it further reinforces their moat in a world where no competitor would be able to catch up.
None of this is new – Amazon has been through these investment cycles before, and they usually end with margins rebounding as the new capacity is digested and the stock significantly appreciates on the way out. We were happy to take advantage of the market’s over-reaction to short term headwinds to add to our position during 2022.
CarMax (KMX)
CarMax is the largest used car retailer in the United States. CarMax has attained this success with a simple value proposition– offer unsurpassed inventory, certified to meet high quality standards, sold at fixed prices, with no haggling and transparent financing. This has created a less adversarial environment in what has historically been characterized as a high stress, low trust transaction.
CarMax also offers customers the ability to trade-in their vehicle to CarMax regardless of whether they purchase a vehicle. The has allowed CarMax to create the lowest cost vehicle acquisition channel in the industry, which has subsequently led to industry leading gross margins on a standardized basis (different auto companies include different things like high margin financing and repairs in their gross margin numbers).
CarMax further monetizes their low-cost vehicle acquisition channel by running a profitable and efficient wholesale auction to move inventory that does not meet the standards of their CarMax branded dealerships. CarMax currently runs the third-largest wholesale auction business in the United States, which allows them to move inventory very quickly, reducing the inventory risk that other dealerships face.
Combining the cheapest acquisition channel in the industry with the most efficient wholesale channel has created a powerful feedback loop that has allowed CarMax to out-scale the competition. This scale means that CarMax has significantly more data than the competition – they know what cars are selling where, in which models, which colors, which towns, etc. This allows them to not only price their cars to sell more accurately, but also ensure they are buying at appropriate prices.
This scale advantage is largely passed on to the customer. CarMax runs their base business at a small spread and then on top of that, with little incremental capital, CarMax runs a very profitable financing operation in CarMax Auto Finance (CAF).
What this all means in practice is that CarMax generates higher returns on capital than their competition (further proven by Carvana’s woes in the market) which CarMax can reinvest in opening more stores and scaling their omnichannel capabilities (home delivery of cars).
The growth runway here remains huge – despite being the largest used car retailer in the United States they still only have roughly 4% share of the total used car market, with the rest mainly consisting of mom-and-pop locations that lack CarMax’s ability to self-finance operations, advertise nationally, and continually reduce their operating costs through scale.
Last fiscal year, as the production of new cars slowed due to supply chain issues, there was a large surge in demand for used cars leading to increasing prices and sales for CarMax. This year as those high prices have acted as a speed bump on demand, it is very likely that CarMax will sell fewer cars, which when paired with a cost base that is being optimized for long-term demand also means shrinking margins, a setup which the market’s short-term bias never likes.
But taking a longer-term view, CarMax has leveraged its position of strength to use this recent market volatility to capture more market share in what is ultimately a scale-based business (brand marketing, inventory sourcing, fulfilment proximity, technology spend, inventory turnover). We believe that this strategy will lead to an even stronger franchise coming out of this down cycle.
Today, the stock trades for roughly 10x 2019 EPS (fiscal year ending February 2020). Consider that back then, CarMax had roughly 3.5% market share, 216 used car stores, and a largely offline business. Today, CarMax has roughly 4.0% market share, 230 used car stores and a fully omnichannel business allowing customers to buy online, offline or any combination thereof, which we believe should be conducive to higher through cycle returns as the costs of this model are optimized over time.
With only a 4% market share of a massive ~$750B market, we believe there is still a long runway of moat-protected low-double-digit EPS growth to be had here, and at a valuation that adds further upside to our returns as shareholders. We are pleased to add to our holdings of this leading franchise at a steep valuation discount to both the market and its historical average.
Alphabet (GOOGL)
Google’s core business is search advertising, where AdWords has proven to be one of the best businesses of all time– when you hear companies talk about ‘customer acquisition costs’, often what they are really talking about is paying their toll to Google. Google’s position as the dominant tollbooth between businesses wanting to reach potential customers is extremely well protected due to the network effects involved in search engines and the data feedback loop that makes those search engines better over time.
That incredible search business has allowed Google to aggressively expand into many other industries – email, hardware, cloud computing, mapping, autonomous driving, etc. The acquisitions of YouTube, DoubleClick and Android have proven very lucrative for shareholders and as such we have grown comfortable with the way management allocates our capital. However, if at any time management chooses to dial back those investments, the amount of cash that could be returned to shareholders would be far more than what today’s financial statements would suggest.
In 2022, Google’s stock sold off in sympathy with much of the rest of the Nasdaq – partly due to the fear of an upcoming recession (advertising spend has traditionally been cyclical) and partly due to margin pressure as they appear to have over hired coming out of the Covid-19 demand surge. But both are short-term issues which have no bearing on the long-term value here.
Another recent bear case in the market has been around the introduction of advanced chat bots utilizing large language machine learning models (LLM). The argument goes that OpenAI, a relatively small company, has managed to challenge Googles dominance in search with their ChatGPT product.
We believe this is a fundamental misunderstanding of the moat that Google maintains not just in search result efficacy but in distribution – whether that be Android, Chrome, Gmail, YouTube, Maps, or through the roughly $20B they pay Apple to be the default option on iPhones. This distribution advantage positions Google as top of funnel for the data feed that will ultimately optimize this new wave of AI based search results.
Google already has their own LLM called LaMDA, as do many of the other technology giants. The reason this technology has not yet shown more prominence in search results is not due to a technological issue (the technology is already widely available and open source) but rather due to an economic issue – each query of an LLM costs more in time and compute relative to the current search system. In other words, where the market currently sees a threat to Google’s search business, LLMs are just another opportunity for Google to further entrench themselves through both their cost and data advantage.
Going forward, Google will likely continue growing high double digits with greater than 30% margins for a long time, while currently trading at a valuation lower than the average company in the market.
Booking Holdings (BKNG)
Booking Holdings is the largest online travel agency in the world- meaning they facilitate transactions between travelers and service providers such as hotels, vacation rentals, airlines, rental car services, restaurants, etc. Travelers win in this model through better pricing, greater selection, reliable reviews, and convenience. Service providers win through increased demand, which is very important considering the fixed costs associated with an empty hotel room.
The beauty of this model is that both sides reinforce each other in a network effect – more travelers mean more suppliers, which means a better traveler experience, which means more travelers, which means even more suppliers.
Along with that network effect, Booking benefits from a structural advantage due to its geographical dominance of the European market. The European hotel market is structured very differently than that here in the US. In Europe, the hotel marketplace is dominated by small independent boutique hotels, in the US the market is dominated by large chains such as Hilton or Marriot. The smaller European hotels are more dependent on Booking to provide demand generation, marketing, customer support, website translation, payments, etc., thus reducing their bargaining power.
This key difference between the European and US hotel marketplaces is the reason that Booking has such a strong position compared to the likes of Expedia who are heavily reliant on the US, where the large hotel chains have more power and less need for an aggregator of room bookings. Once this fact is understood, it is easy to see why Booking consistently generates higher and more stable margins than Expedia and will continue to do so.
The story for 2023 is one largely of latent demand. The Covid-19 crisis and then subsequently the war in Ukraine, put a freeze on a significant amount of travel demand. However, travel is clearly returning, and the long-term trends are unlikely to be diminished.
Going forward, Booking is well-positioned to continue to benefit from the secular trend of increased global online travel spending. As global GDP continues to grow, poor countries continue to get richer and newer generations of adults prioritize experiences over material goods, it is hard to see this trend reversing, even if it was paused for a while.
S&P Global (SPGI)
SPGI is best known for their credit ratings business, but they have diversified recently through their acquisition of IHS Markit further into indexing and financial data services. The acquisition of IHS Markit was poorly received by the market, which argued at the time that SPGI were diluting their amazing credit ratings business and paying for it in undervalued stock rather than through the issuance of debt. We took advantage of that weakness to begin building our position.
Now with hindsight, it has become clear that the market was off-base about the acquisition, as SPGI smartly managed to diversify their business at the top of the credit cycle, while using an inflated valuation to do so, and are now buying back their stock at depressed valuations as the market once again gets it wrong by focusing solely on the short-term credit cycle, rather than the foundation that SPGI has built for the future.
The best way to think about SPGI’s quality going forward is through its common standard moat. There are certain companies that create value for society in direct proportion to their monopoly like status – SPGI is one of them.
For example, take Visa and Mastercard- it is fairly easy to make a new payment rail – banks do it in-house all the time (WeChat is an example) – but it is very hard to make a new rail that is more valuable than the existing rail. This is because the value of Visa and Mastercard is not in their rail, but in the friction that their rail removes from society by having everyone coalesce around it as a single payment standard.
Same in part with Microsoft Office – it is easy to make a competitor that might be better at certain tasks, but the value of Office comes not from being the best at what they do (though in this case they probably are), but in knowing that if you send an excel file, the person on the other side will be able to open that excel file format. If everyone in the world used different file formats, things would ground to a halt.
In other words, by coalescing around a common standard we reduce friction, which creates value and thus the only way to disrupt these “common standard” moats (outside of legal decree) is by having an order of magnitude improvement over the incumbent product such that the benefits of switching standards outweighs the costs. This is hard to do so long as the current standard is “good enough”.
For SPGI and the credit ratings companies, the argument is largely the same: 1) there is value in society coalescing around a standardized credit rating measure (reduces transaction friction) even if that measure is largely arbitrary. Hence the more consolidated the credit rating system is, the more valuable and useful it is, even if you want to say those measures are largely meaningless. And 2) these standards become embedded in institutional workflows so that they are very difficult to remove. It is part network effect and part institutional stickiness.
The same is true of their Indexing business, no amount of technological innovation will change the fact that everyone already benchmarks to the S&P 500, have incorporated that into their workflows, and will be punished by the market if they move away from this common standard. Efficacy of an index is irrelevant, rather just that the index is the common standard – just look at how the news still reports on the Dow Jones Index despite it being a plainly absurd standard (see our previous writings on indices and benchmarks).
Going forward, SPGI’s business will grow in line with the financial markets, meaning roughly 6%-9% organic growth over the course of an entire cycle, with some operating leverage and buybacks driving low-double-digit earnings growth for a very long time.
Charles Schwab (SCHW)
Schwab is a leading provider of securities brokerage and wealth management services to both individual and institutional investors. We have long respected Schwab’s focus on treating their customers so well that it hurts their short-term financials but creates enormous long-term value.
Consider their decision to completely end the business that birthed them, by taking trading commissions to zero. This was not a move from a position of weakness due to price competition, but from a position of strength due to their ability to share their scale economics with customers. This put further strain on their subscale competition, allowing Schwab to acquire TD Ameritrade at a discounted price.
It helps to think of Schwab somewhat like the Costco model. Costco is a retailer that doesn’t make much money retailing, instead passing their scale economics on to the customer in exchange for profitable membership fees. Similarly, Schwab is now an online brokerage that doesn’t make much money from actual trading, instead passing their scale economics on to the customer in exchange for profitable net interest spreads on their customers cash balances.
Thus, with Schwab a growth and profit flywheel is created that relies on scale and efficiency to drive costs lower – allowing Schwab to reduce prices, which attracts more customers and assets even as it invests to add higher value services to cross sell, which further increases the scale and efficiency opportunity. These shared-economics-scaled moats are extremely difficult to compete with.
Going forward, Schwab’s assets continue to grow, further entrenching their position. The competition has either joined them, as with TD Ameritrade, or is barely hanging on, as with Robinhood. This creates a very strong foundation, like a loaded spring, that is set to boom as the interest spread Schwab can earn on customer deposits increases along with the rising interest rate environment.
Schwab’s net new asserts should continue to grow at roughly a 5%-7% rate annually, which when paired with natural market returns, should result in high-single-digit asset growth. As net interest margins track market rates higher, and with continued margin expansion, earnings should grow in the double-digit range for many years to come.
In other words, Schwab is a secular growth story where increasing scale improves operating margins and further drives earnings over time.
Equinix (EQIX)
Equinix is a data center operator, structured as a real estate investment trust (REIT). Unlike other wholesale data center operators which provide large amounts of low-tier commoditized capacity to customers, Equinix’s key service is offering colocation and interconnection services in which customers pay for traffic exchanged within the data center among carriers, enterprise customers, the public cloud, etc.
Despite what prominent short sellers might be saying this year, the interconnected data center market is fundamentally different from the simple data storage data center marketplace. In interconnections, the most important thing is network effects – who are the customers present at each site- the more customers present, the more attractive that site is to other customers.
Equinix’s position in this market is very well protected due to these powerful structural advantages: they have the most cross-connects and key cloud partners, meaning their data centers gain value as more customers collocate, thus increasing the density of the network. Add to that geographic, latency and switching cost considerations, and the moat that Equinix enjoys is extremely wide.
The bear case here assumes two things: 1) that cloud companies like Amazon and Microsoft will compete to lower prices down, and 2) that maintenance Capex is under reported.
On the first point, this is a fundamental misunderstanding of the value proposition Equinix provides to the large cloud companies by offering a neutral interconnection point for companies that may not be friendly with each other to share data. Equinix in its simplest form can be thought of as a toll booth for accessing the cloud, one that companies are happy to pay to reduce frictions. For evidence, one can just look at the price per cross connect that Equinix has been able to charge their customers, which has seen a steady march higher even as the public cloud companies have grown in dominance.
On the second point, it helps to understand that Equinix does not own the equipment in their data centers, they simply provide a shell with some power cables and air conditioning. HVAC, power backups, etc. can take a long time to wear and tear, thus if you are opening many new data centers, like Equinix has been, as a percentage of revenue maintenance spend does in fact stay low.
Going forward, we believe that Equinix’s data center business is still in its early growth stages, driven forward by secular trends in global internet access, e-commerce, IoT, high-definition streaming video and enterprises moving to the cloud – which the market has yet to fully appreciate.
Mastercard (MA)
Mastercard is an inflation immune tollbooth business collecting a fee on global electronic payments regardless of whether those payments are credit, debit, online, mobile, etc. It is a truly outstanding business.
Their position in the market is extremely well protected due to a very difficult chicken and egg problem that would-be competitors would need to solve – issuers want to issue cards that consumers want to use, consumers want to use cards that merchants accept, and merchants want to accept cards that issuers issue. This creates a powerful network effect as the more of each party on the network; the more convenience, the more data, the more secure, the better the overall network is for everyone, which explains why only a handful of networks have come to dominate the market over time.
Mastercard has held up relatively well in 2022. Part of this was due to just how resilient their business model is, and part of it was due to the tide going out on many would-be competitive threats like fintech, buy-now-pay-later, and cryptocurrency alternatives.
Going forward, Mastercard’s earnings growth will continue to be driven by the continued secular trend away from cash-based payments – a trend magnified by the inexorable shift towards e-commerce and the increasing ease in which Merchants can access Mastercard’s network (mobile payments, browser payments, smart speaker payments, IoT payments, etc.).
American Tower (AMT)
American Tower is one of the largest owners of cell towers in the US (along with Crown Castle, which we also own for different reasons). These are incredibly valuable assets, as they are arguably the bottleneck when it comes to us all consuming more and more mobile data. American Tower simply owns the tower and rents space to the carrier companies (AT&T, Verizon, etc.) to affix their equipment on very long-term contracts– which results in a low fixed cost, stable, hugely cash generative business.
These towers typically have 10-20-year inflation-linked contracts with the carriers. It is very hard to build any new towers as zoning is so difficult to achieve, so there is little competition. The cash flow predictability is exceptional, and American Tower is taking this cash flow and reinvesting it into new towers (and portfolios of existing towers) in faster-growing and much earlier stage markets like Brazil and India, providing a tremendous growth runway.
American Tower is a wonderful example of a company that lies squarely in the middle of a huge, multi-decade trend. This trend is the exponential growth of mobile data consumption driven by ever-increasing smartphone penetration, faster available mobile internet speeds, a huge growth in content (particularly video such as Netflix, Disney+, etc.) being consumed on mobile devices, as well as huge growth in the number of internet-enabled devices.
In 2022, American Tower, along with Crown Castle which we will talk about next, got caught up in a broad-based selloff of REIT companies in advance of the rising interest rate environment. We believe this is a mistake by the market to lump these great companies into this single bucket. For us, we never underwrote these investments assuming interest rates would stay at zero in perpetuity and with risk free interest rates at roughly 4%-5%, or at 20x-25x non growing earnings multiples, we would still much rather own these tower companies where we know earnings will be growing at high single digit rates for many decades to come.
Crown Castle (CCI)
Like American Tower, Crown Castle is an owner of cell phone towers. Whilst Crown Castle benefits from the same incredible economics and cash flow generation from its legacy towers business that American Tower does, Crown Castle is choosing to reinvest its considerable cash flow into a different end market.
Within the US, it is incredibly difficult to build more large cell towers as obtaining zoning for a 300ft mast that may or may not cause health concerns is incredibly difficult. But that presents a problem, if the towers are the bottleneck in our increasing usage of mobile data, then there just simply aren’t enough of them to carry all the data people are now consuming on their mobile phones. This problem is only worsening as we move to 5G, Internet of Things, and connected vehicles.
One answer to this is small cells – effectively mini towers that are placed on lamp posts, traffic lights, etc. in dense urban areas. These small cells are linked by fiber optic cable, placed up and down streets, and on buildings to offload capacity from overloaded macro towers nearby. Small cells are a very fast-growing market, but one which is dependent on owning the fiber backbone. Crown Castle have spent $14B+ buying and installing fiber optic cabling over the last five years, now making them one of the largest owners of fiber in the 25 largest metro areas in the United States.
This has been a very heavy upfront investment, which the market tends not to like as the returns are initially low. But the market isn’t looking far enough into the future – this fiber backbone gives Crown Castle many years of capacity on which to roll out small cells. They can gradually densify their networks, such that cash returns in the future should be vast compared to those today.
Crown Castle is the leader in this space and is likely to remain so given their structural advantages. We see management as having made the hard decisions to invest now for returns tomorrow. We intend to partner with them to enjoy those future returns. In the meantime, we are supported by substantial cashflow from the existing tower portfolio and a significant dividend, which continues to grow with reassuring consistency.
Texas Instruments (TXN)
TXN designs, manufactures, and sells analog semiconductors to electronics designers and manufacturers worldwide. For example, when your thermostat tells you what temperature it is in your house, or when your car tells you your tire pressures, that is possible because of analog chips. Analog chips can interpret continuous variables like the above examples, while digital chips can only interpret binary variables like 1 or 0.
A good model for thinking about TXN is the “small thing into big thing” keystone product model where the value a business provides to its customers is extremely high relative to the price being charged.
The analog chips that TXN sells might cost less than a dollar and then go into product platforms that might cost 10s of thousands of dollars, like a car. In other words, these are often mission critical components with very high-performance requirements that are designed into product platforms that may last decades. As such switching costs are high and market share in the industry is very stable, only really shifting through M&A.
You have probably heard us talk in the past about how we largely avoid the semiconductor industry because of both cyclicality fears as well as the fear of technological disruption. The players in the space that operate at the precipice of technological innovation (Intel, AMD, Nvidia, Samsung, Qualcomm, etc.) are continually leapfrogging or falling behind each other due to their pace of innovation (or lack thereof).
This is not the case with TXN and the analog semiconductor industry. Analog products don’t really become obsolete in any given year and while cyclicality is still an issue, inventory will not need to be written down as in other industries.
Consider that the two most important end markets for TXN are industrial and automotive – both of which offer secular growth going forward. Factories are being equipped with ever more sensors while automotive vehicles are expected to double their semiconductor content over the next decade as the shift to electric vehicles continues. When a TXN chip is awarded a place on any of these platforms, it is likely that place will remain relevant many years into the future, much longer than the average market participant is even considering.
What we end up with is a very stable business with limited market share shifts and secular tailwinds behind it that produces massive cash flows. The management team here has proven to be excellent capital allocators in the past, a benefit we expect will continue going forward.
Management takes a logical (and sadly rare) approach to share buybacks – increasing them when the stock price is falling and pulling back when their share price is high. Just this past month they announced a further $15B buyback on top of the $8.2B they already had outstanding. This $23B repurchase program represents roughly 16% of their market capitalization today.
The reason we believe we are getting the opportunity to own this great business at what we would call a depressed valuation is likely because the company is going through a capex cycle at the same time that cyclical fears in their end markets are starting to build.
Free Cash Flow will likely remain depressed for the next few years as new semiconductor fabs are built to support more revenue growth. But by our math, the returns on these new fabs are going to be in the 30% range. The market hates companies that are spending money today, but the reward won’t come until a few years down the line. Lucky for us, we have no issue with this setup.
We expect topline to grow 7%-8% through cycle, and with margin expansion and share buybacks FCF should compound at a high single/low double-digit rate for many decades to come. At today’s depressed valuation, we expect a mid-teens IRR on our investment for a very high quality business.
And we take further comfort in that even if the market continues to sell off, TXN is in a great position to both buy back a large portion of the market capitalization as well as pursue opportunistic M&A.
Wyndham Hotels & Resorts (WH)
WH is the largest hotel franchisor in the world by number of hotels with over 9,000 properties. They’re the dominant player in the economy space, but also play in the mid-scale and upper mid-scale. After recently completing the sale of their few remaining owned properties, as well as management contracts related to their La Quinta acquisition, the company is now ~100% franchised, meaning very asset light.
This is a simple business to understand: a typical franchise has a duration of about 20 years with little churn. The standard agreement has a franchisee paying somewhere around 4.0% to 5.5% (depending on geography and chain scale) royalty on room revenues. The franchisee will also pay 3% to 4% on top for marketing and reservation fees, but these are more akin to cost pass throughs than revenue. Lastly, the franchisee will pay an access fee charge when members of WH’s loyalty program book a stay, who tend to book for longer and generate more revenue.
This business is remarkably resilient – continuing to be cash flow positive even during the worst of the 2020 Covid-19 lockdowns. Hence, they run at about 2.5x leverage today with a target of 3-4x over the long run (leveraged buybacks wouldn’t be a shock as they probably got too defensive with the balance sheet last year).
The basic growth algorithm for WH is Net Room Growth, plus RevPAR (revenue per available room) growth, less churn.
The historical retention rates here have been about 95%, but that is distorted by significant rationalization of the portfolio in recent years. Management believes the core number is closer to 99%+ with the addition of higher retention brands like Microtel and LaQuinta.
WH organically adds roughly 8% to its system size each year, which when you back out that ~5% churn number gets you to the 2%-4% system growth that management talks about going forward. If true churn is less than 5%, then organic room growth here will come in at solid mid-single digits.
RevPAR is market driven and cyclical but tends to grow low-single-digits domestically, and higher internationally where WH are starting to mix more.
So, combining the above, we have a predictable growth model over a full cycle, somewhere around mid-single to high-single-digits organically. Which when paired with operating leverage and share buybacks translates to low-double digit earnings growth over time. WH is a stable cash cow, with a long runway ahead of them, which overtime can create tremendous value.
Recently with the new weakness in the share price, management has allocated a significant amount of cash flows to shareholder returns, in the form of both dividends and buybacks, providing us with a solid margin of safety.
Ocado Group (OCCDY)
At its core Ocado is a technology company – but a technology company that started its life as a purely online UK supermarket. As you will have noticed, many grocers have been offering some version of “e-commerce” for years now (third-party delivery, in-store pick-up, etc.), but crucially most of these grocers lose money on the business.
Despite these losses, grocers must continue offering these online services to customers or otherwise risk losing a loyal customer. Since the industry barely generates low single-digit margins as is, adding a loss-making segment on top of that can create real issues. Consider that all existing grocers around the world have been trying at this for years and so far, all have failed to make the online experience sufficiently profitable.
Even Amazon, a company with arguably infinite capital and some of the most impressive logistics and infrastructure in the world, entered this market and then pulled out again only a few years later as they could not make it work. We have also seen new third-party models recently pop up such as Instacart, but sadly these also fail to offer the end-to-end solution of a sufficiently profitable endeavor.
And yet Ocado, having spent 2 decades investing huge amounts into R&D now operates a purely online grocery business that has normalized margins of almost 10%, and that should continue to expand towards 12%+. Compare that to your traditional supermarket of 2-5%, and you begin to see the opportunity. Any company that can enter a market the size of global grocery ($6-7 trillion) and quadruple the margins of the incumbents can clearly create a lot of value over time by selling that model to others.
So, Ocado now has two businesses: a UK online-only supermarket and an international licensing business of their end-to-end delivery technology to other retailers. While the UK business has been operating for many years, the international business is still in its infancy and has yet to produce any meaningful revenues. Put together, the company continues to be loss-making as they are investing heavily in building international capacity.
For the last year, Ocado’s share movement has been dominated by news flow around just the UK business which represents most of the earnings today, but in the future will be a small portion of the overall value of the business as the international licenses are set to generate significant revenue and earnings growth in the next few years.
This is creating a significant opportunity for investors today – based only on the contracts that have already been signed, Ocado is going to generate annual revenue of ~£1B from its international business, likely as soon as 2026 based on their current build rate. That revenue is also likely to come with around 50% EBITDA margins, so we’re looking at ~£500M or around 5x the size of the current UK business.
That is purely from the contracts already signed and in place, assuming no further growth. But it’s likely that the existing contracts continue to grow in scale as they have done already (more distribution centers per customer, Kroger buying Albertsons), as well as Ocado adding new customers (recently signed a deal with Korea’s Lotte group).
Right now, Ocado is trading at a market cap of less than £5B for a business that we believe is likely to be generating more than that in annual sales in just a few years’ time. And notably, the share price recently hit levels not seen since before any of the international business even existed.
We see this as a great example of classic market short-termism and lack of genuine business analysis. A small number of temporary issues that hurt the current UK business is all the media and the market have focused on, while in the background the company continues to execute on the international opportunity, which will be the driver of our returns going forward.
Tyler Technologies (TYL)
Tyler is the largest software provider that solely serves public sector verticals – addressing government needs in areas such as financial, judicial and court systems, tax, record-keeping, property appraisal, public safety, school districts, etc. Tyler’s start was in the small and medium-sized local government space, but through acquisitions and scale they have moved up market over time, increasing their TAM at each step.
It likely won’t come as a surprise to learn that government agencies are not the most technologically forward-thinking customers. Often, these agencies are staffed by risk averse bureaucrats that do not have the same desire for efficiency that we might find in the private sector. Many of these agencies will hold on to decades-old infrastructure, not upgrading until something quite literally breaks. Consider that the average system that Tyler replaces in this market is over 20 years old, and once Tyler gets their foot in the door, they will likely be entrenched for the next 20 years all well.
Tyler has invested in upgrading their own software solutions over the past decade, creating a platform product that allows for historically siloed government agencies to share and action data – for example, allowing court systems to talk to law enforcement systems or allowing tax agencies to take real time online payments. As these integrations become more important to customers, Tyler’s existing business benefits from the networks they’ve already established in their installed base. In other words, as one county upgrades their systems to Tyler, it further spurs neighboring counties to do the same.
Going forward, Tyler is set up with significant intangible R&D assets and high switching costs, to dominate this attractive, long growth runway market of which they currently only have a high-single digit share of. Tyler should be able to sustain 10-12% organic growth and at least mid-double-digit earnings growth for a very long time.
In 2022, Tyler sold off with other growth names and the market didn’t seem to like the accelerating pace of Tyler’s SaaS (software as a service) transformation and the impact that would have on margins over the next year or two. But these SaaS transition stories should be well understood by now as being long term value accretive for any investor that can take a longer view.
Management believes growth is about to significantly accelerate, as governments are flush with cash from the recent infrastructure bill that needs to be spent by 2024. Tyler does just over $1B in revenue today. It is entirely reasonable that that could 10x over the next decade considering the size of the opportunity they are going after.
Disclosures: This website is for informational purposes only and does not constitute an offer to provide advisory or other services by GCI Investors in any jurisdiction in which such offer would be unlawful under the securities laws of such jurisdiction. The information contained on this website should not be construed as financial or investment advice on any subject matter and statements contained herein are the opinions of GCI Investors and are not to be construed as guarantees, warranties or predictions of future events, portfolio allocations, portfolio results, investment returns, or other outcomes. Viewers of this website should not assume that all recommendations will be profitable, or that future investment and/or portfolio performance will be profitable or favorable. GCI Investors expressly disclaims all liability in respect to actions taken based on any or all of the information on this website.
There are links to third-party websites on the internet contained in this website. We provide these links because we believe these websites contain information that might be useful, interesting and or helpful to your professional activities. GCI Investors has no affiliation or agreement with any linked website. The fact that we provide links to these websites does not mean that we endorse the owner or operator of the respective website or any products or services offered through these sites. We cannot and do not review or endorse or approve the information in these websites, nor does GCI Investors warrant that a linked site will be free of computer viruses or other harmful code that can impact your computer or other web-access device. The linked sites are not under the control of GCI Investors, and we are not responsible for the contents of any linked site or any link contained in a linked site. By using this web site to search for or link to another site, you agree and understand that such use is at your own risk.
All references and views offered, including but not limited to stocks, companies, investments, investment styles, market returns, expectations, forecasts or estimates and any other area of investing are the opinion of the manager and should not be taken as facts, projections or guarantees. All such opinions are subject to change are do not constitute a recommendation or solicitation to buy or sell a particular security.